voices quoted
Quoted in this piece
Why AI Citation Statistics Expire Faster Than You Think
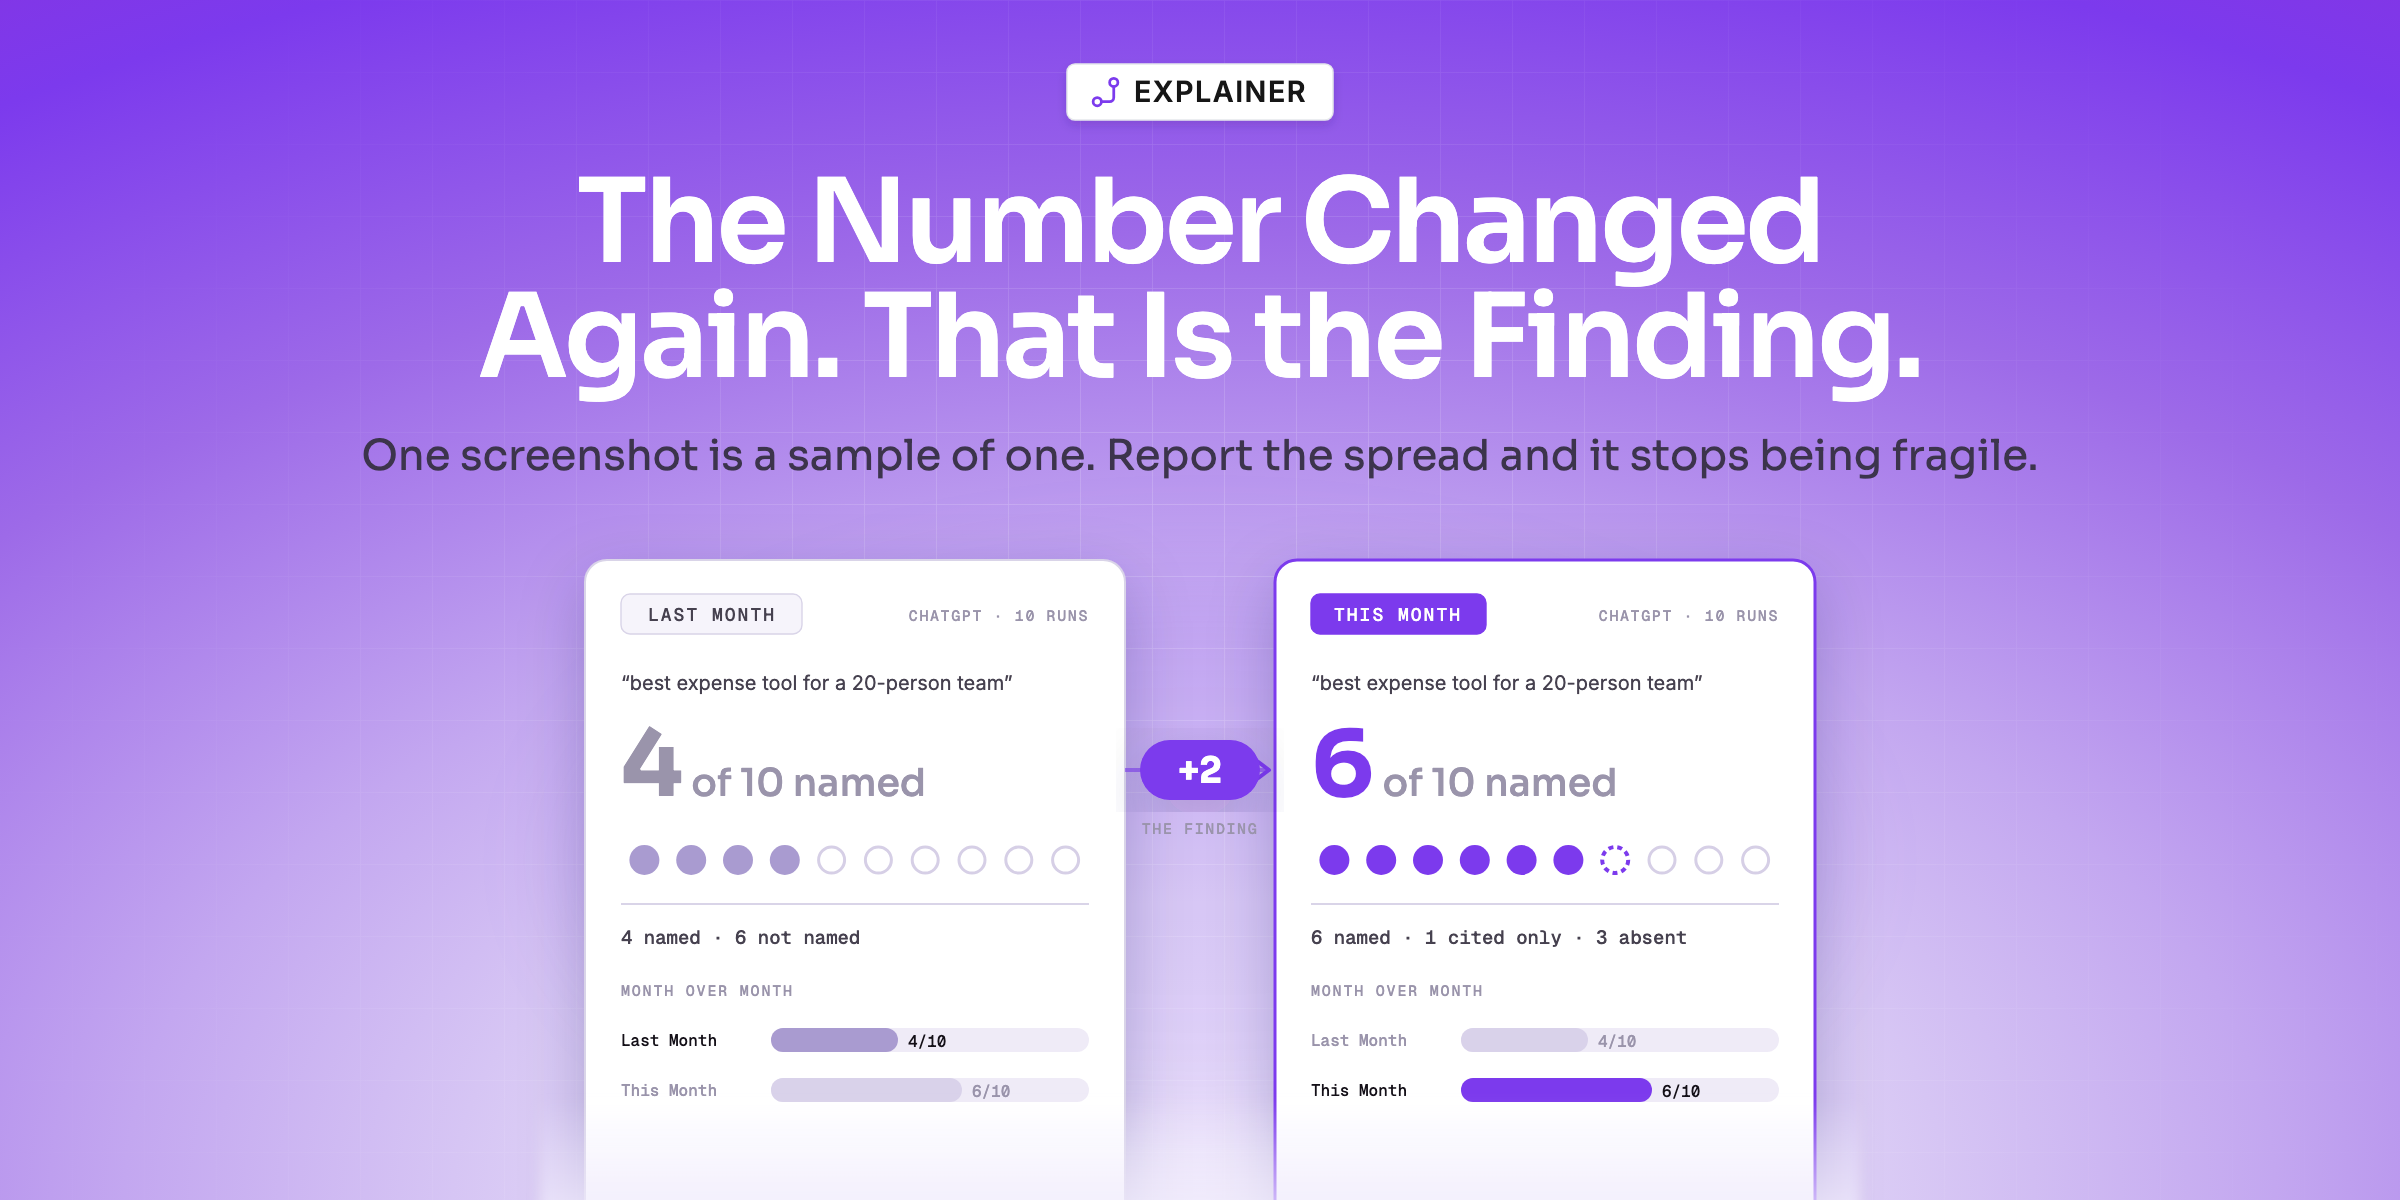
A citation-share figure describes a few weeks that already ended. One engine's source mix reportedly fell from 60% to 10% in six weeks, hidden by an average.


The short version
A citation-share figure describes one engine's retrieval behaviour during one window, and that behaviour moves in weeks. One widely discussed account has a single engine's source mix collapsing from roughly 60% to 10% inside six weeks. Almost no one noticed, because the number most teams watch is an average — and an average is built to hide exactly that.
Key highlights
- 1 A source-mix number is a photograph, not a constant
- 2 The move was reported as a cliff, not a slope
- 3 Blending four engines turns a collapse into a mild dip
- 4 A statistic quoted without naming its engine has lost the useful part
- 5 An average hides which engine moved, so you cannot react
- 6 Mechanism claims last years; source-mix claims last weeks
- 7 Strip the number out and see whether the advice still stands
- 8 Find the measurement window, not the publication date
- 9 A study nobody has re-run is a starting point, not a fact
- 10 Your own dated rate per engine cannot expire without you noticing
The statistic in your deck describes what one engine did during a few weeks that have already ended.
That is not a criticism of the study. It is what a citation-share figure is. It counts which domains an engine reached for during a measurement window, and retrieval behaviour is a product decision that can change on a Tuesday. Nothing about the number was wrong when it was taken. It simply stopped describing the present, quietly, without anyone updating the slide.
This piece is about that decay: how fast it happens, why almost nobody sees it, and what to do with source-mix numbers instead of building a strategy on top of one.
A Citation Share is a Photograph, Not a Map
The clearest account of this in the wild concerns the most-repeated claim in the category — that Reddit dominates what AI search cites.
Reddit's citation share in ChatGPT specifically dropped from roughly 60% to around 10% in about six weeks. Not a gradual decline. A cliff.
Read what that is and is not. It is one practitioner's account, of one engine, across one window. We did not run it, we cannot reproduce it, and it should not be quoted as a measured fact of the field — including by us.
What it does establish is the shape of the risk, and the shape is the useful part:
- The move was fast. Weeks, not quarters. Any planning cycle longer than the decay window is planning against a number that has already moved.
- It was engine-specific. The claim is about ChatGPT. Nothing in it says the other engines did the same thing, and the whole point of the next section is that they probably did not.
- It was a cliff, not a slope. A gradual drift you might catch in a monthly review. A step change between two reviews looks exactly like a measurement error, which is how it gets dismissed.
- The people most exposed were the ones who had acted on the original number. A strategy built to feed one source mix is the thing that breaks when the mix changes.
Whether the specific figures hold is for whoever ran it to defend. That a source-mix number can move that far, that fast, is the part you have to plan around either way.
Why Almost Nobody Noticed It Move
Because the number most teams look at is an average, and an average is designed to hide exactly this.
Most people building Reddit-first GEO strategies didn't notice because they weren't tracking per-model data. They were looking at aggregate visibility and assuming all models behaved the same way. They don't.
Blend four engines into one figure and one engine can invert while the headline barely twitches. Here is the arithmetic, with round numbers to make it obvious:
| Engine | Before | After | Blended view |
|---|---|---|---|
| Engine A | 60% | 10% | |
| Engine B | 20% | 25% | |
| Engine C | 15% | 20% | |
| Engine D | 25% | 30% | |
| Average | 30% | 21% | a nine-point dip, easy to call noise |
The engine that fell off a cliff shows up as a mild soft patch. Anyone reading only the bottom row concludes the quarter was slightly down and moves on. Anyone reading the rows above it knows their entire approach on Engine A stopped working.
An AI-search statistic quoted without naming its engine has already thrown away the part that mattered. That is true of the numbers you collect yourself and the ones you read.
What a Blended Number Costs You
Three specific things disappear into an average, and each one is a decision you would otherwise have made.
| What the average hides | What you lose by not seeing it |
|---|---|
| one engine moving sharply | the chance to react inside the window the move happened in |
| which engine your gains came from | you scale the wrong thing, because you cannot tell what worked |
| a real decline masked by a rising engine | flat looks like stable when it is actually two opposite trends |
There is a fourth, subtler cost. A blended figure makes every engine look interchangeable, which quietly encourages one content approach for all of them. The engines retrieve differently — and being read by one is not the same as being cited by it — so the one-size approach usually turns out to be an approach tuned to whichever engine happened to dominate your average.
Not Every Statistic Expires at the Same Speed
"All AI stats go stale" is too blunt to be useful. Some of them will still be true in three years. Sorting them by what they actually describe tells you how long each one is good for.
| Kind of claim | Example shape | Roughly how long it lasts |
|---|---|---|
| Mechanism | the engine rewrites your question before searching | years — it is architecture |
| Behaviour | this engine currently prefers pages that answer early | months, and it drifts |
| Source mix | this share of citations went to these domains | weeks |
| Market | this share of searches now produces a generated answer | months, but revised often |
The ordering is not arbitrary. It tracks how far the claim sits from a product decision somebody can ship on a Tuesday.
- Mechanism claims are the safest to build on. That an engine rewrites your question into several searches, or reads passages rather than whole pages, describes how the thing is put together. Those change with a rearchitecture, not with a tuning pass.
- Behaviour claims are worth acting on and worth re-checking. They describe a current preference. Acting on one is usually fine, because most of them point at things that are good practice anyway. Quoting one as a permanent law is not.
- Source-mix claims are the most quoted and the shortest-lived. They are also the most attractive, because they appear to tell you exactly where to go. That is precisely why they get built on.
- Market claims move slowly but get restated. The underlying trend is real; the specific percentage tends to be a vendor's estimate and gets quietly revised.
Two practical consequences follow. The first is that a mechanism claim rarely needs a number at all — "the engine searches for its own rewritten query, not your sentence" is more useful than any percentage attached to it, and it does not expire. The second is that when a piece of advice depends on a source-mix figure, the advice inherits that figure's shelf life. Strip the number out and see whether the recommendation still stands. Usually it does not, and that is the finding.
This is also how to read anything you are being sold. A pitch built on mechanism is describing something durable. A pitch built on a source mix is describing a window, and the window may have closed before the deck was made.
How to Date a Statistic You Did Not Collect
Most published figures do not make this easy, which is itself informative.
- Find the measurement window, not the publication date. They are frequently a year apart. A 2026 blog post can be reporting a 2025 crawl, and often does not say so above the fold.
- Check whether the engine is named. "AI search" as the subject is a warning sign. Retrieval behaviour is per-engine and the aggregate is the least useful cut of it.
- Look for a re-run. A study anyone has repeated is worth ten that nobody has. If the same team published a second window, compare the two before you quote either.
- Ask what would have had to stay still. Model versions, search partners, index refreshes, product changes. If several of those have moved since the window, treat the figure as history rather than as a fact.
If a number survives that, quote it with its window attached: "in a study measured over six weeks in early 2026". Six extra words, and it will still be defensible when somebody checks it next year.
- Never quote a source-mix figure with no date. The date is not context, it is part of the measurement.
- Never present a single-engine figure as a fact about AI search. Name the engine in the same sentence as the number.
- Never build a content plan whose payoff depends on the mix staying put. The mix is somebody else's product decision.

What to Build Instead of a Source-mix Strategy
The reason people quote these figures is that they want to know where to put their effort. That is a fair question and the source-mix number is a bad answer to it.
A source mix tells you where an engine has been reaching lately. It does not tell you whether you would be picked from that source, and it changes on a schedule you do not control. Two things survive better:
- Your own rate, per engine, dated. Ask your buying question, count how often you appear, keep the engines separate, write the date. That number is small, yours, and never expires without you noticing — because you took it.
- Whatever holds regardless of the mix. Being retrievable, answering the specific question early, and having the evidence sit next to the claim are not tied to one engine's current taste in domains.
The trap is spending a quarter becoming excellent on one platform because a number said that platform was where citations came from. When the mix moved, the work did not transfer — the effort was in the channel, not in the page.
A useful test before committing a quarter to anything: ask what has to stay true for this to pay off.
- If the answer is "our page has to be the best answer to this question", the work transfers. Every engine is trying to find that, however differently they go about it.
- If the answer is "this engine has to keep preferring this kind of source", you are renting. It may still be worth doing, but price it as a bet with an expiry, not as an asset.
- If the answer is "this figure has to still be accurate", and you have not checked when the figure was taken, you do not yet know what you are betting on.
None of this means ignore published research. It means read it for the mechanism it describes and hold the percentage loosely, because the mechanism is what you can build on and the percentage is what will be different next quarter.
Start instead from the thing you can measure yourself. What counts as a mention, and how to count it is a smaller claim than any published statistic, and it is the only one that will still be true next month.
Conclusion
Source-mix statistics describe a few weeks that have already ended, and they move faster than most planning cycles. Read published research for the mechanism it describes and hold the percentage loosely. Then measure the thing you control: your own appearance rate, kept per engine, with the date beside it. It is a smaller number than anything published and it is the only one that will still be true next month.
AI Citation Statistics and Decay: Frequently Asked Questions
How often do AI citation statistics change?
Is Reddit still the top source for AI citations?
Why should I not average my AI visibility across engines?
What is the difference between a publication date and a measurement window?
Can I still use an old AI search statistic?
What should I measure instead of source mix?
Find the exact growth leak in your business — in 2 minutes.
Paste your URL. Our AI agent crawls your site, diagnoses what's broken, and ships a step-by-step fix plan. Free, no signup.
Run free audit